Establishing Standards for Acceptable Waveforms in Nerve Conduction Studies
I. Introduction FIGURE 1 Ulnar motor nerve conduction study, recorded from the ADM muscle. The ulnar motor nerve is stimulated at three different locations, and the parameters for each resulting CMAP are labeled as follows: O = onset, P = peak, and z = baseline crossing. ADM, abductor digiti minimi; CMAP, compound muscle action potential FIGURE 2 Median sensory nerve conduction study, recorded from digit 3. The resulting SNAP parameters are labeled as follows: O = onset; P = peak; and T = trough. SNAP = sensory nerve action potential FIGURE 3 Ulnar motor nerve with F wave, recorded from the ADM muscle. The minimal F-wave latency is depicted by the vertical line at 28.2 milliseconds. Note that the study includes the required 10 F waves). ADM, abductor digiti minimi EDX studies often contain noise or interference that distorts the waveforms being studied. To minimize unwanted components of the signal, EDX studies must be performed utilizing instruments capable of recording the neurophysiologic responses while minimizing extraneous signals that can cause measurement error (see description of appropriate EDX instruments below). Major sources of noise or interference include: power lines, amplifier noise, lighting, and other background sources. Power line interference is common. The following two figures show examples of power line interference. Note how it is impossible to accurately measure the SNAP onset, peak, trough, or return to baseline in the first waveform (FIGURE 4). It is impossible to identify a physiological waveform in the second trace recorded during performance of a motor conduction study (FIGURE 5). FIGURE 7 SNAP waveform contaminated by stimulus artifact during performance of a sural sensory nerve conduction study. The resulting waveform parameters are depicted as follows: O = onset, P = peak, and T = trough. Note how the stimulus artifact and/or oversaturation shown in Traces A1, A2, and A4 significantly impacts the measurement of the true peak-trough SNAP amplitude, as well as the onset latency and subsequent calculation of sensory nerve conduction velocity. SNAP, sensory nerve action potential
The purpose of this position paper is to clarify what constitutes an acceptable NCS waveform in the practice of electrodiagnostic (EDX) medicine. Waveforms are generated and evaluated as part of both the nerve conduction study (NCS) and electromyogram (EMG) portions of the EDX examination. This document covers the NCS portion of the EDX testing.
The term “waveform” in NCS describes the action potentials that are most commonly generated by surface electrical stimulation of a peripheral nerve to produce sensory nerve action potentials (SNAPs), compound muscle action potentials (CMAPs), or mixed nerve action potentials (MNAPs) that contain both motor and sensory components. Other generated waveforms include F-waves and H reflexes, which provide information about proximal, longer segments of some nerves. Axon reflexes (A waves) can be seen in motor conduction studies. Somatosensory evoked potentials (SSEPs), brainstem auditory evoked responses (BAERs), and visual evoked responses (VERs) are examples of additional waveforms produced by nerve or sensory receptor stimulation.
Appropriately trained individuals utilizing standardized techniques and appropriate instrumentation generate and assess these different types of waveforms as part of the EDX examination. After the EDX medicine consultant takes a history from the patient referred for testing and performs a focused physical examination to better establish deficits in function which may be present, the NCS and needle EMG examination required to evaluate the working diagnosis are selected and performed. The waveforms produced by these studies are evaluated in real time. The real time review may dictate that additional NCS and EMG are required in the testing session to be able to establish the final diagnosis or diagnoses. Having the appropriate education in anatomy, physiology, and pathology to understand disease processes, plus training and experience in EDX techniques, allows performance of the NCS and EMG studies in a way that maximizes the accuracy and reliability of the results and the diagnoses rendered.
II. Appropriately Trained EDX Medical Consultants
As previously defined by the AANEMi , and as identified in the AANEM EDX Laboratory Accreditation requirements,ii the training and experience necessary to be competent in performing and interpreting NCS and EMG examinations includes:
• Board certification in Neurology or Physical Medicine & Rehabilitation;
• Perform at least 100 EDX studies per year;
• Have completed a minimum of 3 months of EDX training; and
• Personally perform or provide direct supervision, as defined by CMS, for the NCS portion of the EDX testing.
A practitioner who does not meet these standards of training and experience can compromise the reliability of the EDX exam results and should not be performing EDX studies.
III. Accepted Techniques and Procedures for Generating Waveforms
As EDX medical practices have evolved over 40+ years, definitions of acceptable techniques to generate EDX waveforms have been developed. The standard EDX textbooksiii describe in detail the procedures and techniques to be used for obtaining quality waveforms. To maximize accuracy and reliability of the generated waveforms these procedures and techniques must be consistently followed. Patient specific factors such as age, body habitus, presence of edema, tolerance of the testing, and ambient factors such as limb temperature, and electrical interference, etc. must be addressed to assure reliable waveforms.
Neurophysiologic waveforms are obtained during the performance of NCS by stimulating directly over a nerve, and recording at a distant site over the nerve for sensory (SNAP) and mixed nerve action potential (MNAP) NCS, or over a muscle for CMAP, F-waves, H reflexes supplied by the stimulated nerve. The recorded waveforms contain varying degrees of frequency content, with CMAPs containing primarily low-frequency components, while SNAPs and MNAPs tend to exhibit higher frequencies. The responses also vary with respect to amplitude, with SNAPs and mixed NAPs generating waveforms measured in microvolts (µ), and CMAPs measured in millivolts (mV), due to the amplification effects of the summated individual muscle fiber action potentials. F-waves and H reflexes are generally measured in microvolts. The amplifier gain and filter bandwidth of the amplifier and signal processing system should be chosen to capture the signals without undue distortion of the waveforms.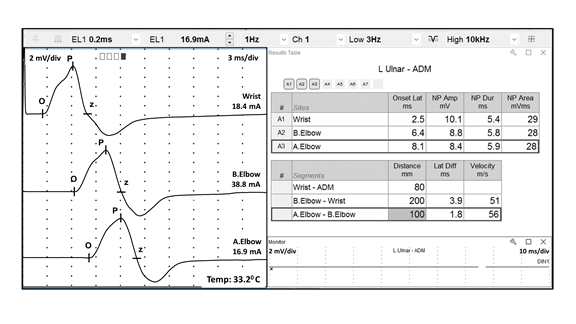
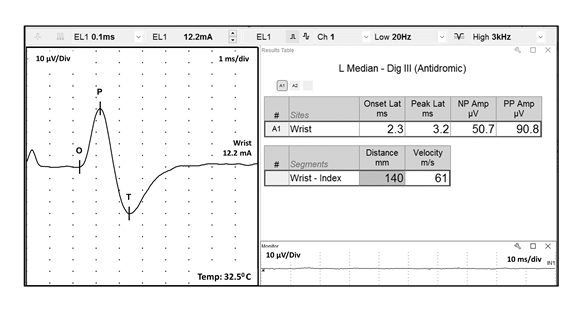
In order to accurately interpret neurophysiologic waveforms, the following parameters should be clearly identifiable: polarity, configuration, onset, peak(s) and return to baseline. These data allow measurement of the waveform’s amplitude and speed of conduction by assessing latency to onset or peak and/or calculating conduction velocity. Reporting these parameters is required by the Current Procedural Terminology (CPT) standards to be able to submit billing charges for NCS. Examples of acceptable quality CMAP (FIGURE 1), SNAP (FIGURE 2), and F-wave (FIGURE 3) waveforms are shown below. Note the easily identifiable onset and peak parameters. In the F-wave example, note that multiple sequential traces are generated since F-waves have variable latencies. It is the standard of care that at least 10 F-waves should be assessed. 
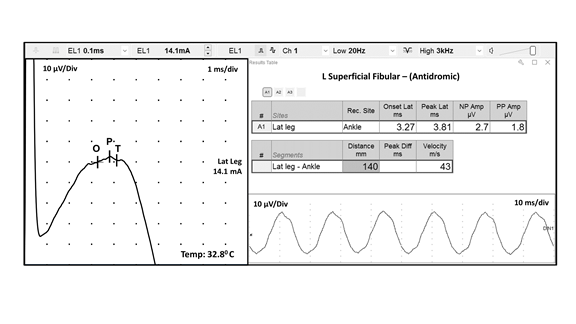
FIGURE 4 Electrical interference of 60 Hz during a sensory nerve conduction study. This nonphysiological waveform is depicted by the following parameters: O = onset, P = peak, and T = trough . This recording bears no resemblance to the expected sensory waveform (Figure 2) and it is not accepted for analysis
FIGURE 5 Electrical interference during a motor nerve conduction study. This nonphysiological waveform is depicted by the following parameters: O = onset, P = peak, T = trough, and R = return to baseline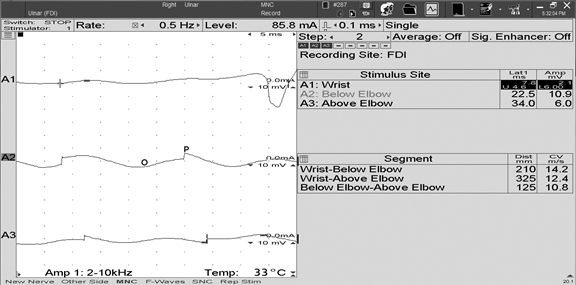
FIGURE 6 Unwanted electrophysiological noise from coactivated ulnar innervated hand intrinsic muscles during performance of an ulnar sensory nerve conduction study. The automatic cursors correctly labeled the onset (O) of the SNAP, but erroneously labeled the peak (P) and trough (T). The true SNAP peak is depicted by the vertical arrow pointing down, whereas the true trough of the SNAP is depicted by the vertical arrow pointing up. SNAP, sensory nerve action potential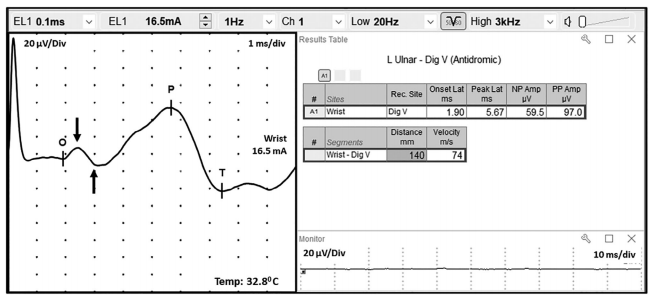
Note that in both figures the automatic cursor placement by the instrument resulted in inaccurate measurements. These are examples of waveforms that are NOT of acceptable quality for accurate assessment of a patient’s neurophysiologic status:
The following actions may further reduce power line interference:
• use a dedicated electrical circuit from the breaker panel which only powers the EDX instrument
• apply recording electrodes with proper amount of conductive gel
• ensure optimal placement of the ground electrode
• reduce skin-electrode impedance by lightly abrading the skin prior to electrode application
• reduce impedance mismatch by shortening or twisting the lead wires together
• turn off unnecessary nearby electrical equipment
• position power line cords away from patient and operator
• use the instrument’s 60 Hertz notch filter
• replace worn recording/ground electrodes
Noise may be reduced by lowering the high frequency filter setting and by signal averaging to improve the signal-to-noise (SNR) ratio. In the case of unwanted electrophysiologic noise, it may be helpful to try to relax the patient, or place the reference electrode over a tendon or bone. The figure below shows an example of unwanted electrophysiologic noise, which is fairly common when performing an antidromic ulnar sensory NCS (FIGURE 6). Note that the desired SNAP parameters are difficult to measure due to volume conducted contamination by co-activated ulnar innervated hand muscles. The motor contamination can be reduced by maintaining passive spread of the fingers or by adjusting the location of the recording electrodes.
Stimulus artifact may interfere with optimal recording of the desired response. Stimulus artifact results from the stray currents of the stimulating electrodes being recorded by the instrument. Stimulus artifact can be reduced by most of the same actions listed above for reducing power line noise, by rotating the anode about the cathode, and by wiping off excess sweat from the skin. The latter eliminates unwanted paths of current flow from the applied stimuli. The following represents an example of stimulus artifact interfering with the accurate measurement of the desired waveform during a median sensory NCS (FIGURE 7):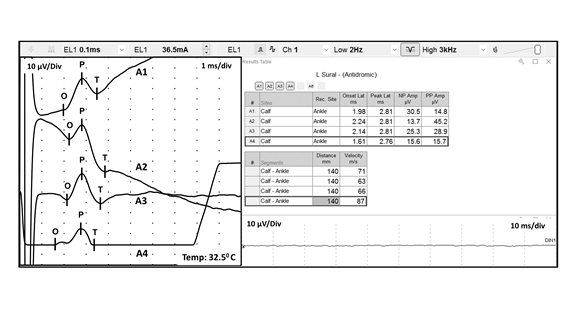
Note how the wavering baseline results in different SNAP peak to peak amplitudes, comparing Trace A1 (14.8 ,icrovolts) to Trace A2 (45.2 microvolts). Both of these erroneous measurements are significantly different than the true amplitude depicted in Trace A3 (28.9 microvolts). Also, note how the wavering baseline in Traces A1 and A2, and the oversaturation in Trace A4, results in inaccurate labeling of the waveform onset (O). This results in incorrect calculation of the sensory nerve conduction velocity. Therefore, utilization of waveforms contaminated by significant stimulus artifact and/or oversaturation (as seen in Traces A1, A2, and A4) may result in a diagnostic
error.
Finally, there are instruments that are purported to be able to measure electrophysiologic waveforms, but are incapable of doing so. The following (FIGURE 8) is an example of waveforms obtained during performance of a “pain fiber nerve conduction study (pf-NCS)”. This graph represents artifact and does not include physiologic wave forms as described above and pictured in Figure 3.
IV. Appropriate Equipment Needed to Obtain Quality Waveforms
EDX instruments should be able to reliably record and display neurophysiological waveforms so that measurable parameters can be defined.
The AANEM has previously defined the parameters of an appropriate EDX instrument.iv Briefly, the instrument must use a differential amplifier to improve the signal-to-noise ratio. At a minimum, the differential amplifier should have: high input impedance (>1,000M-Ω), high common-mode rejection ratio (CMRR>100 dB), noise level with input shorted being less than 0.6 uVRMS, and a channel selection mechanism if multiple channels are needed. It must also have a gain (sensitivity) with the ability to acquire signals from 1 microvolt (µ) to 50 millivolts (mV) and a minimum of 3 analog gain stages (digital amplification increases noise significantly and can mask the biological signal).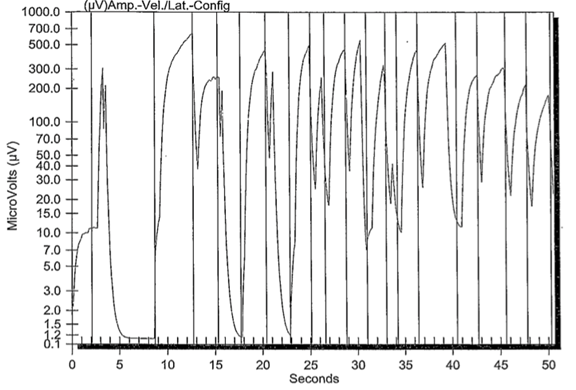
FIGURE 8 Pain fiber nerve conduction study. Note there are no physiological waveforms identified
The instrument must also have adjustable filters to create an appropriate band-pass to measure the desired waveform. The low frequency (high pass) filter should range from 1-2,000 Hz, the high frequency (low pass) filter from 100-10,000 Hz, and a notch filter if needed of 50 or 60 Hz to reduce power line noise.
The instrument must be capable of displaying the desired neurophysiologic signal. Therefore, the sensitivity/gain control must have the ability to range from 1 µ to 10 mV per division, with a sweep speed range of 0.1 to 500 ms per division.
Some equipment that was initially designed to assess sensory nerve functioning (quantitative sensory tests or QST) is now being marketed as an alternative to standard and accepted EDX equipment. Promotional information about this equipment asserts that it can more sensitively diagnose patients with radiculopathies when compared to EDX equipment. Unfortunately, the waveforms generated by this equipment do not meet the current standards for nerve conduction studies. Studies performed using this type of equipment should not be considered for nerve conduction study reimbursement.
V. Conclusion
Nerve conduction studies (NCS) are a valuable and established procedure for the evaluation of peripheral nerve function. Nerve conduction studies can identify focal, segmental, or diffuse peripheral nerve demyelination. Additionally, NCS can identify partial or complete axonal loss. These different types of peripheral nerve pathology can only be determined by accurate measurement of the waveform parameters obtained during performance of the NCS. This Position Statement describes what constitutes an acceptable NCS waveform. An acceptable NCS waveform should include clearly identifiable polarity, configuration, onset, peak(s) and return to baseline. Only then can one accurately measure the speed of nerve conduction (either by measurement of distal onset or peak latency, or by calculation of nerve conduction velocity), and amplitude of the nerve response (measured from the onset to the peak, or peak to peak, of the response). If these parameters cannot be clearly identified, then the waveform should be considered substandard (and also should not be submitted for reimbursement according to the AMA CPT guidelines). The NCS should subsequently be repeated, utilizing the strategies outlined above, until an acceptable waveform is obtained. Failure to do this may result in NCS that do not reflect the true function of the patient’s peripheral nerve function, and subsequently should not be considered reliable for diagnostic purposes.
References
[i] AANEM Position Statement. “Who Is Qualified to Practice Electrodiagnostic Medicine?” Updated and reapproved November 2017.
[ii] AANEM EDX Laboratory Accreditation
[iii] Examples of Standard EDX Textbooks:
Aminoff, Michael J. Aminoff's electrodiagnosis in clinical neurology. 6th ed. Pennsylvania, PA: Saunders; 2012.
Buschbacher, Ralph M; Kumbhare, Dinesh A; Robinson, Lawrence R. Buschbacher's manual of nerve conduction studies. 3rd ed. New York, NY: Demos Medical; 2016.
Dumitru, Daniel; Amato, Anthony; Zwarts, Machiel. Electrodiagnostic Medicine. 2nd ed. Philadelphia, PA: Hanley & Belfus, Inc.; 2001.
Kimura, Jun. Electrodiagnosis in diseases of nerve and muscle: principles and practice. 4th ed. Oxford: Oxford University Press; 2013.
Lee, Hang J; DeLisa, Joel A; Lee, Hang J. Manual of nerve conduction study and surface anatomy for needleelectromyography. Surface anatomy for clinical needle electromyography. 4th ed. Philadelphia, PA: Lippincott Wilkins and Williams; 2005.
Leis, A Arturo; Schenk, Michael P. Atlas of nerve conduction studies and electromyography. New York, NY: Oxford University Press; 2013.
Neal, Peggy J.; Katirji, Bashar. Nerve Conduction Studies: Practical Guide and Diagnostic Protocols. AANEM, 2011.
Pease, William S; Lew, Henry L; Johnson, Ernest W. Johnson's practical electromyography. 4th ed. Philadelphia, PA: Lippincott Williams & Wilkins; 2007.
Preston, David C.; Shapiro, Barbara E.. Electromyography and Neuromuscular Disorders: Clinical-Electrophysiologic Correlations. 3rd ed. London: Elsevier; 2013.
Tatum WO. Atlas of Artifacts in Clinical Neurophysiology. Springer Publishing Company, New York; 2019 Weiss, Jay; Weiss, Lyn D; Silver, Julie K.; Dowling, Dennis J. Easy EMG: a guide to performing nerve conduction studies and electromyography. 2nd ed. London: Elsevier; 2016.
[iv] AANEM Position Statement. “Electrodiagnostic Study Instrument Design Requirements.” Approved July 2015.
Document History
Creation of New Guidelines, Consensus Statements, or Position Papers
AANEM members are encouraged to submit ideas for papers that can improve the understanding of the field. The AANEM will review nominated topics on the basis of the following criteria:- Members’ needs
- Prevalence of condition
- Health impact of condition for the individual and others
- Socioeconomic impact
- Extent of practice variation
- Quality of available evidence
- External constraints on practice
- Urgency for evaluation of new practice technology
